Research Questions
We advance understanding of air quality and its connections to human and environmental systems. Using machine learning and data science as tools for scientific discovery, we tackle complex challenges in air pollution and wildfire smoke. Our work aims to reveal new scientific insights through innovative methods and unconventional data sources.
Research Areas
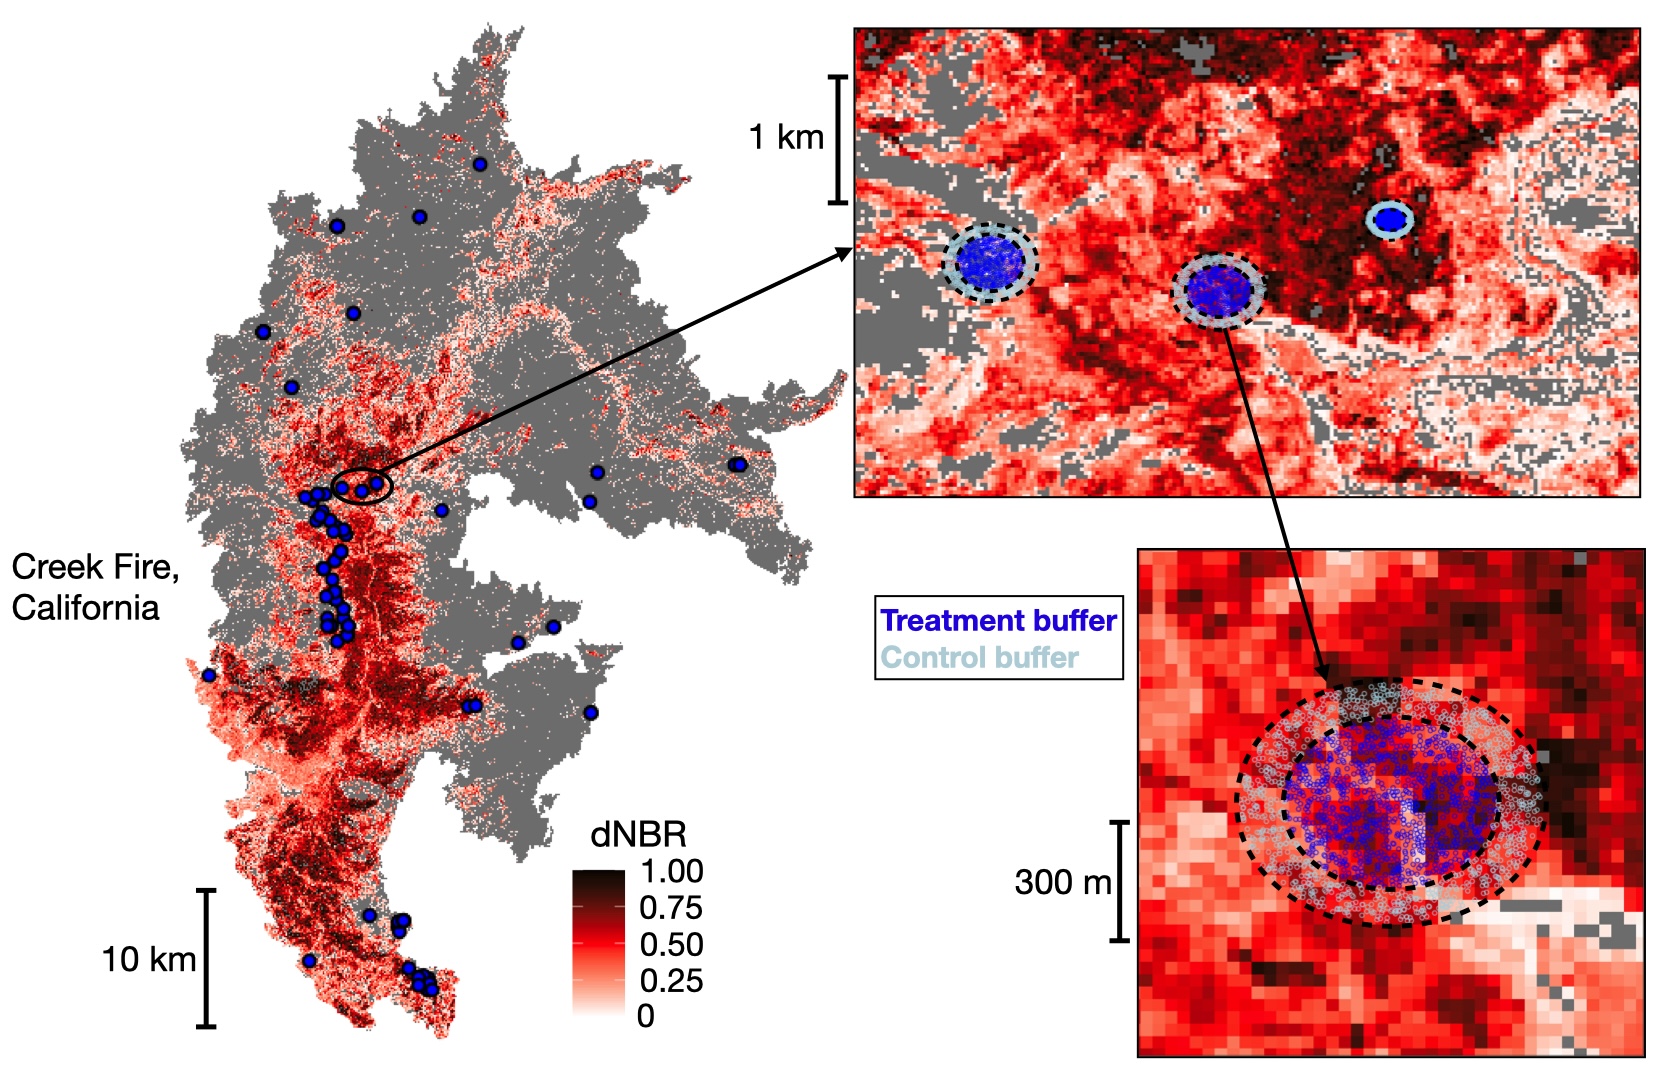
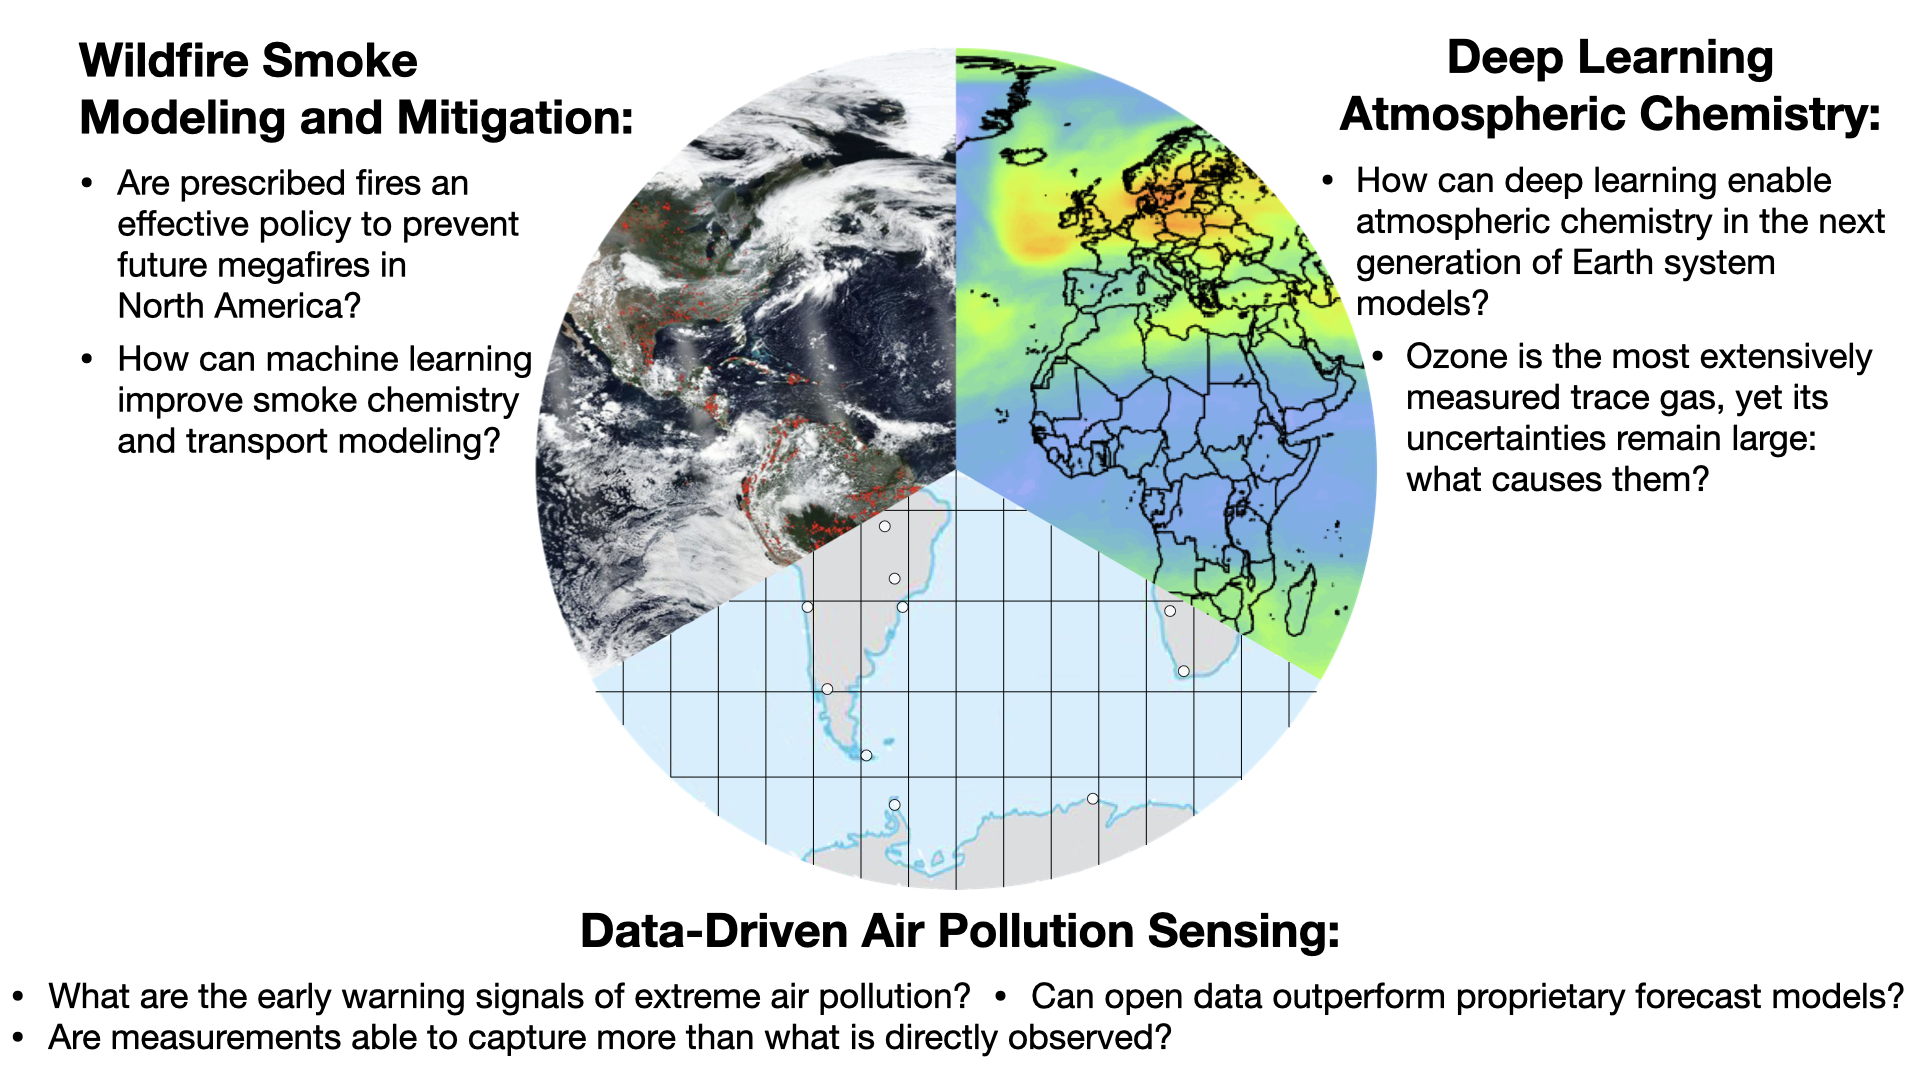
Wildfire Smoke Modeling and Mitigation
Due to a warming climate, a legacy of fire suppression, and expanding development into the wildland-urban interface (WUI), the western US has experienced a recent rise in extreme wildfire seasons. Wildfires not only damage ecosystems and infrastructure but also degrade air quality and pose serious public health risks from smoke exposure. Prescribed ("Rx") fire is often promoted as a policy solution in the western US, yet its use is limited in practice and few studies have evaluated its effectiveness against wildfire impacts. Our research is motivated by gaps in our understanding: (1) we lack observational and modeling systems to accurately project how scaling Rx fire useage would affect air quality and health outcomes in the western US; and (2) the efficacy of past Rx fire treatments remains poorly quantified across varied landscapes and fire seasons. It is unclear whether expanding Rx burning will reduce wildfire risk or simply add to the smoke burden without preventing future fires. Some of our recent work shows that Rx fire treatments, while modestly effective, are frequently least successful in the WUI (a central focus of wildfire policy). Such findings highlight the limitations of current wildfire strategies and underscore the need for data-driven, policy-relevant approaches to guide the proposed expansion of Rx fire.
Publications: Kelp et al. (2025) AGU Adv., Kelp et al. (2023) Earth's Future
Mentored Publications: Chung et al. (2025) ES&T,
Co-Authored Wildfire Publications: Feng et al. (2025) PNAS, Qiu et al. (2025) Nature, Qiu et al. (2024) ES&T, Liu et al. (2024) Int J Wildland Fire
Points for Policymakers: Prescribed fire research brief
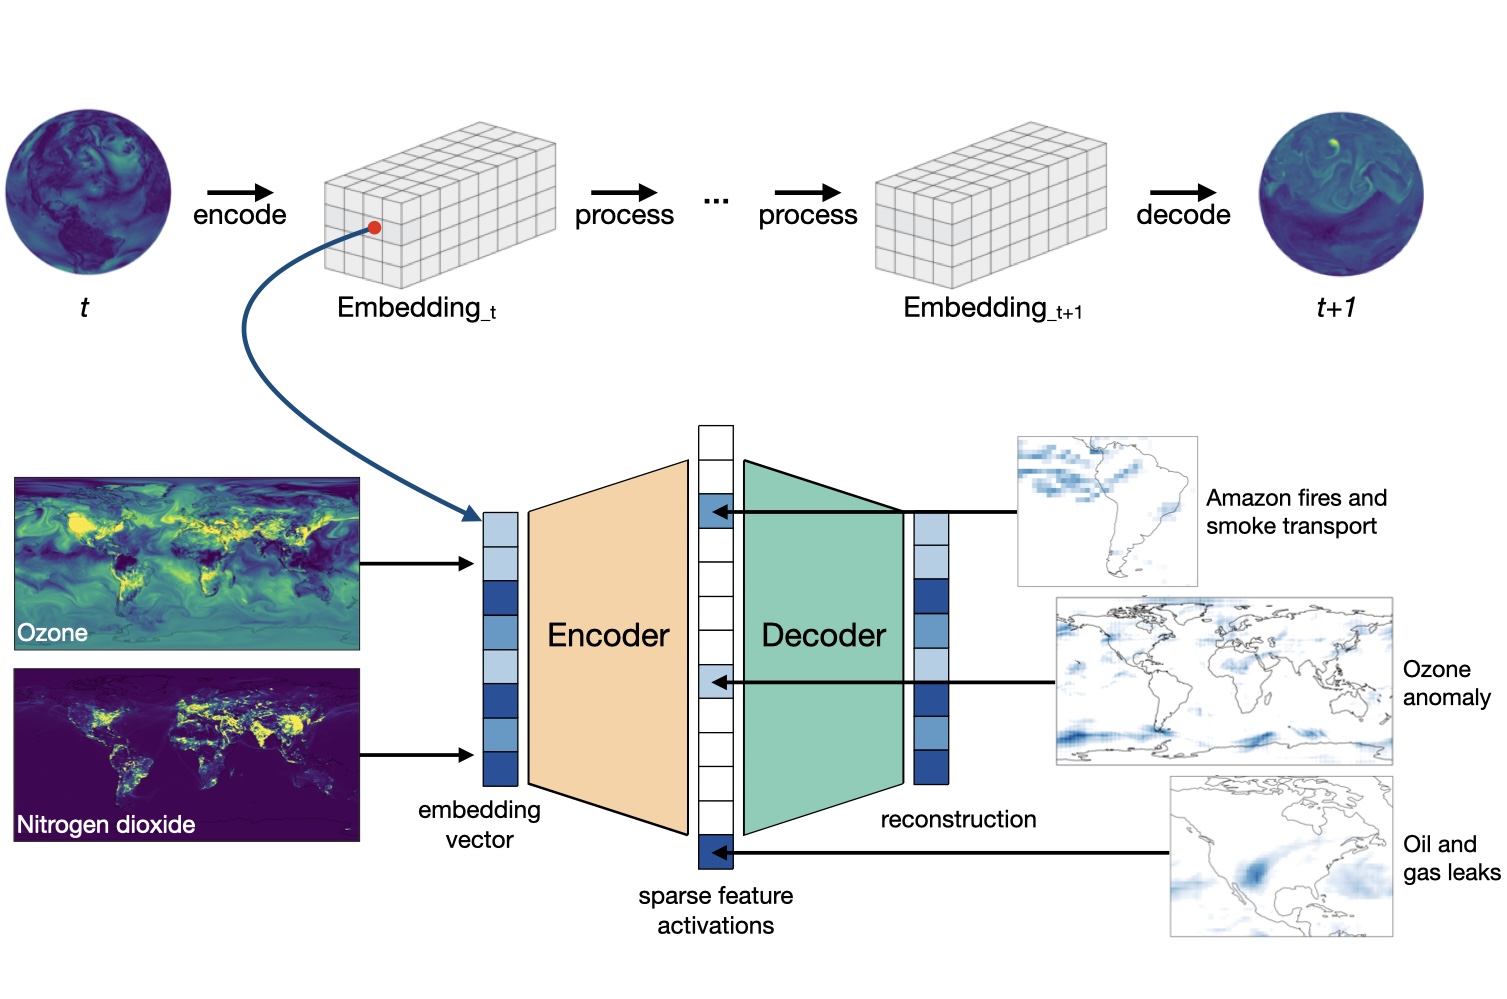
Deep Learning Atmospheric Chemistry
Ozone is an air pollutant that harms human health, damages vegetation, and acts as a short-lived climate forcer. Despite being the most measured trace gas in our observational history, global atmospheric models still disagree on even basic ozone trends and spatial patterns. Accurately predicting ozone requires capturing nearly every major process in the atmosphere (e.g., emissions, chemistry, stratosphere-troposphere exchange, boundary layer mixing). Few problems in geoscience are as well-observed and yet as difficult to predict, which makes ozone a particularly revealing test for AI. Our past work explored how AI methods can be used to emulate and replace computationally costly components of global atmospheric models for fast, stable simulations. Our current research probes what AI foundation models learn about atmospheric chemistry and the extent to which they can complement (or even substitute) conventional process-based models. We work towards physically consistent foundation models that blend data-driven and mechanistic components to better diagnose what drives ozone bias (i.e., mechanistic interpretability).
Publications: Kelp et al. (2022) JAMES, Kelp et al. (2020) JGR: Atmos, Kelp et al. (2018) ArXiv
Future Priorities of AI in Air Quality: Highlight Paper on AI for Tropospheric Ozone Research (2025), NeurIPS AI4Science Dataset Competition Winning Paper (2025)
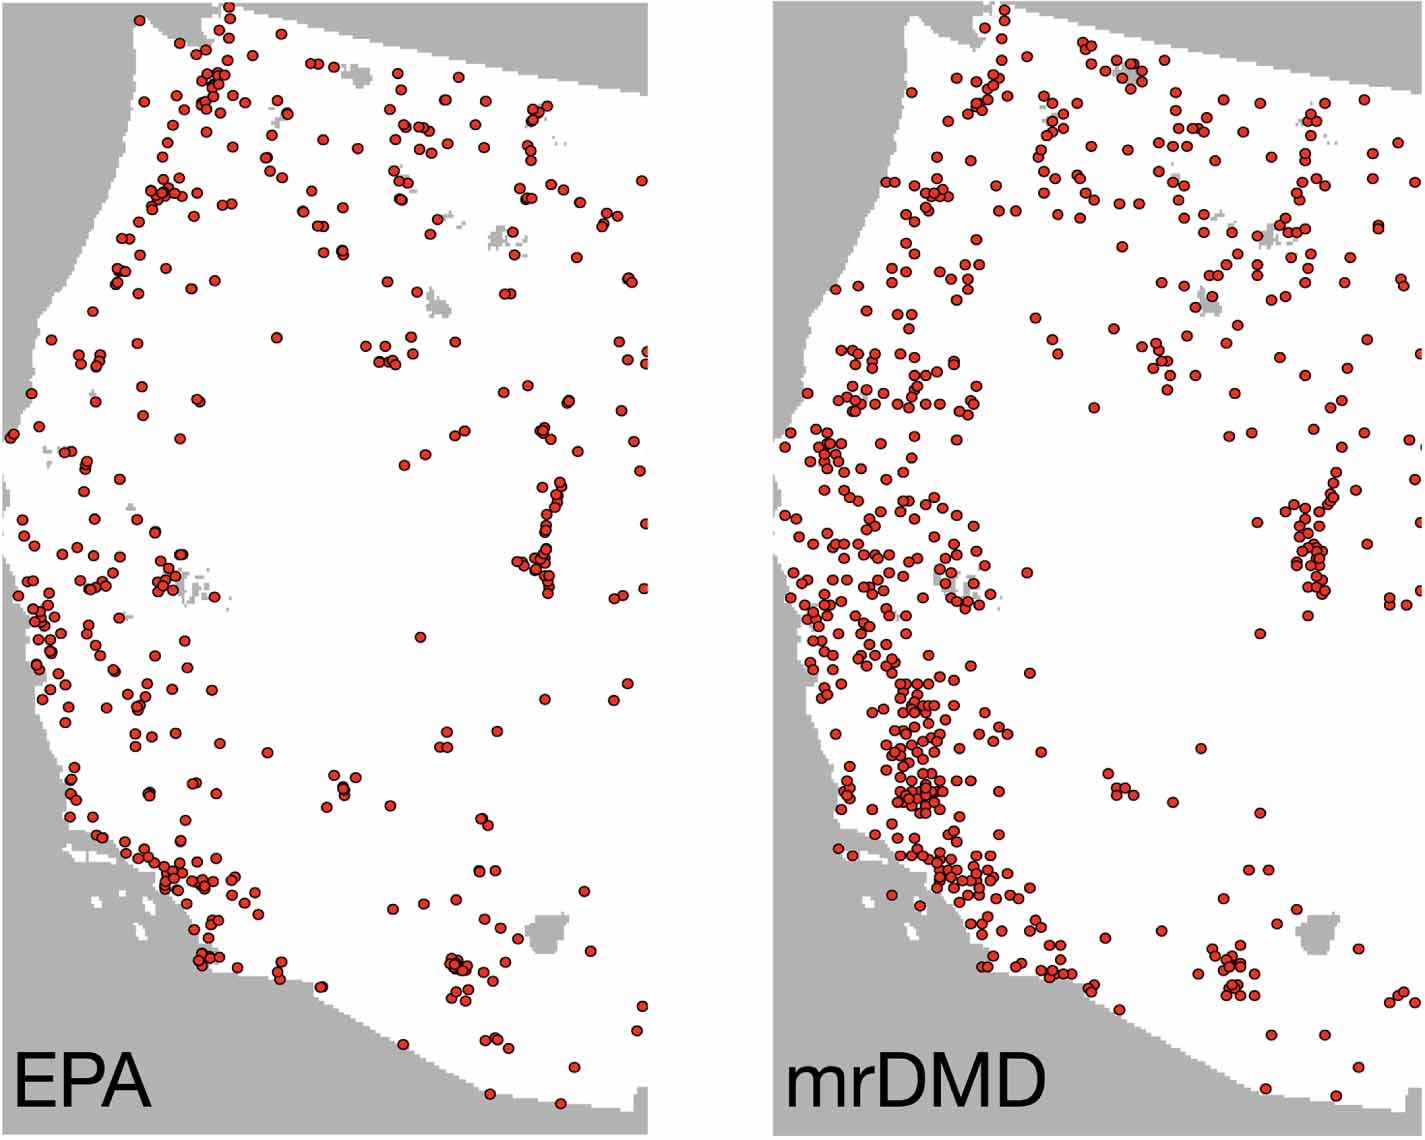
Data-Driven Air Pollution Sensing
Despite major investments in air quality (AQ) monitoring, existing sensor networks often fail to capture extreme air pollution. We use data-driven methods to improve the design of sensor networks, air quality forecasts, and environmental early warning systems. In one national scale study, we applied compressed sensing algorithms, a signal processing method that uncovers important spatiotemporal patterns found in data, to determine optimal AQ sensor locations based on recent pollution trends. This analysis revealed major gaps in the current EPA's monitoring network across the western US, particularly in regions affected by wildfire smoke. In a related study, we incorporated equity constraints into the sensor network optimization to improve coverage in historically segregated neighborhoods in cities such as St. Louis and Houston. These approaches provide a basis for rethinking how we design AQ monitoring networks to better capture extreme events and ensure more equitable coverage. At the same time, commercial platforms increasingly deliver AQ forecasts through proprietary systems, raising concerns about transparency and public accessibility. These systems are likely to become more prevalent in the coming decade due to the rapid commercialization of environmental data and advances in AI and cloud computing. In response, our research is guided by a set of core questions: What are the early warning signals of extreme air pollution (fires, inversions, smog)? Can open data outperform commercial forecasts?
Publications: Kelp et al. (2023) GeoHealth, Kelp et al. (2023) ERL, Kelp et al. (2022) ERL
Co-Authored Sensor Publications: Kawano et al. (2025) Sci. Adv., Yang et al. (2022) ES&T